Syncly Social Index
·
Makeup
·
e.l.f. on video, October 2026
e.l.f. appears in everyday makeup looks, lip combinations and affordable-product comparisons. e.l.f. scores 51.7 on the Syncly Social Index, ranking #6 in the makeup panel, unchanged from September. This report covers October 1 through 31, 2026.
Syncly Social Index score
A 0–100 score built from six short-form video signals, relative to brands in the same category.
The strongest component scores are sentiment (100/100) and share of voice (88.9/100). e.l.f. appears in 3,742 videos and accounts for 10.8% of this ten-brand panel’s volume. Its share of the tracked beauty video conversation is up 0.2% from September after normalizing each month’s collection.
The lowest component scores are momentum (11.1/100) and high reach (11.1/100). 6.4% of matching videos reach 100,000 views; the top ten creators account for 5.4% of volume. Untagged exposure is 18.2% of the reviewed sample. Among 58 sampled videos not labeled sponsored, 8 are positive and 0 negative. Component scores are relative to the category panel.
Key numbers
change in share of category videos vs. the prior month
Most-viewed e.l.f. videos
The most-viewed videos mentioning the brand this month.
A month of e.l.f. videos
Videos per day. Highlighted days are the three biggest, with the top video from each.
What e.l.f. videos are about
Oct 8 (185 videos): Shares a makeup routine focused on wear time. This is the day’s most-viewed matching post; it does not establish what caused the volume peak.
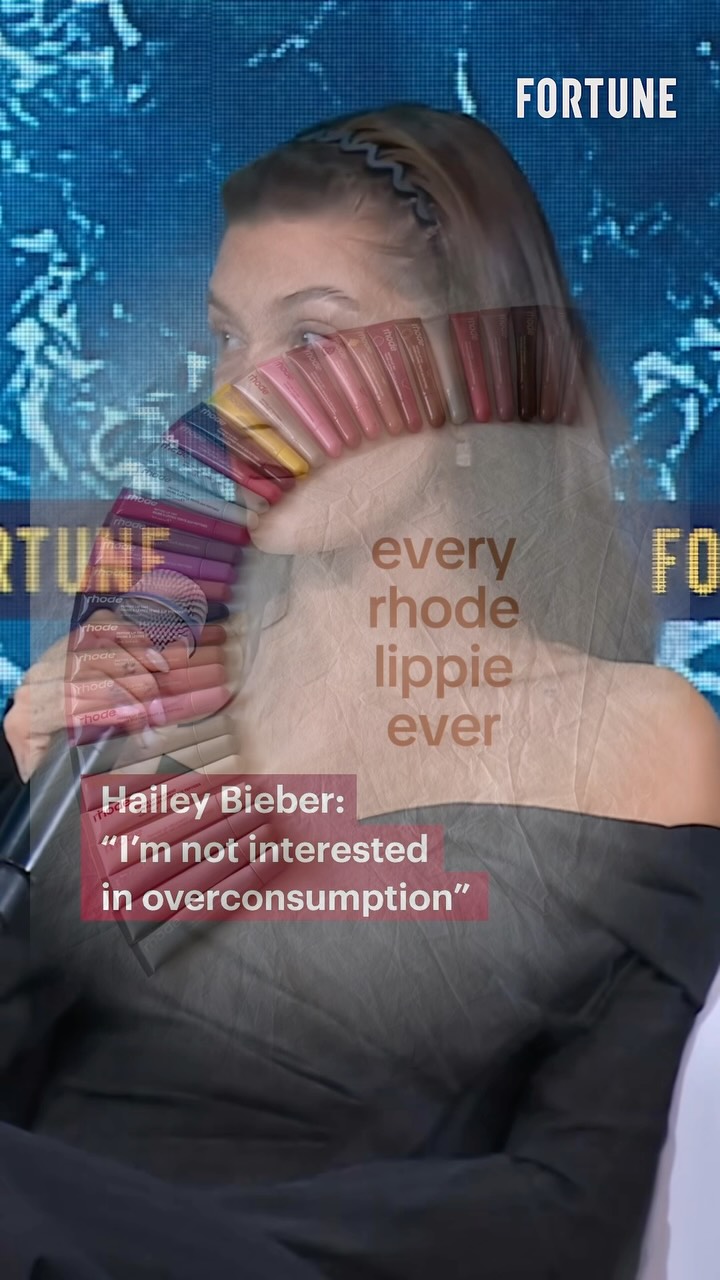
Oct 13 (180 videos): Jeffree Star unboxes and criticizes e.l.f.’s holiday advent calendar. This is the day’s most-viewed matching post; it does not establish what caused the volume peak.
Oct 1 (178 videos): Discusses a past relationship while applying makeup. This is the day’s most-viewed matching post; it does not establish what caused the volume peak.
Common extracted terms include makeup (1,976 videos), elf (1,777 videos), elfcosmetics (894 videos). Beauty also enter the brand query, so not every match demonstrates an e.l.f. Demonstrates a ten-minute natural makeup routine (10,888,728 views). This example illustrates a matched video and does not explain the whole conversation. The most-mentioned products among those tracked are Power Grip Primer (317 videos, share down 5.4% from September); Glow Reviver lip oil (302 videos, share up 34.2% from September); Halo Glow Liquid Filter (279 videos, share down 20.6% from September). Product queries can overlap.
Most-mentioned products
| Product | Videos | Change |
|---|---|---|
Power Grip Primer | 317 | −5.4% |
Glow Reviver lip oil | 302 | +34% |
Halo Glow Liquid Filter | 279 | −21% |
Camo concealer and contour | 153 | −13% |
Holiday Advent Calendar | 57 | |
Peel of Approval lip liner stain (new) | 54 |
Top keywords
Top hashtags
Where and who
TikTok 57.7% (2,159 videos), Instagram Reels 26.3% (985 videos), YouTube Shorts 16% (598 videos). Of 2,159 TikTok videos, 642 (29.7%) are labeled sponsored and 1,517 are not. The most active matched accounts are @elfyeah (37 videos), @hoenest (35 videos). Among videos with a known creator location, US (1,610 videos), GB (264 videos) lead. Location does not identify the audience.
Platforms
Sponsored vs organic on TikTok
Most active creators
Where the videos come from
Untagged and sentiment
18.2% of sampled videos contain the brand in video-derived text without naming it in the caption, title or hashtags. Open a reviewed video with a video-derived brand mention (4,565,332 views). Open a reviewed video with a video-derived brand mention (3,901,354 views). Open a reviewed video with criticism of e.l.f. The non-sponsored sample contains 0 negative videos out of 58; it is a selected review sample, not a population estimate.
Unlock the full data
Enter your work email to see every row in the gated tables on this page.
Brands mentioned alongside e.l.f.
Share of the brand’s videos that also mention each brand. These are the brands viewers see it compared with.
Product reports
Compare with competitors
Frequently asked questions

The Syncly Social Index scores brands from 0 to 100 using short-form video on TikTok, Instagram Reels and YouTube Shorts. It combines six signals: video share of voice (25%), untagged mentions (20%), momentum (15%), sentiment (15%), high-reach videos (15%) and creator breadth (10%). Each signal is scored relative to the other brands in the same category for the month. Sentiment and untagged figures come from a sample of videos; any claim about a specific video links to that video.