At-Home Beauty Devices: Market Intelligence Report 2026
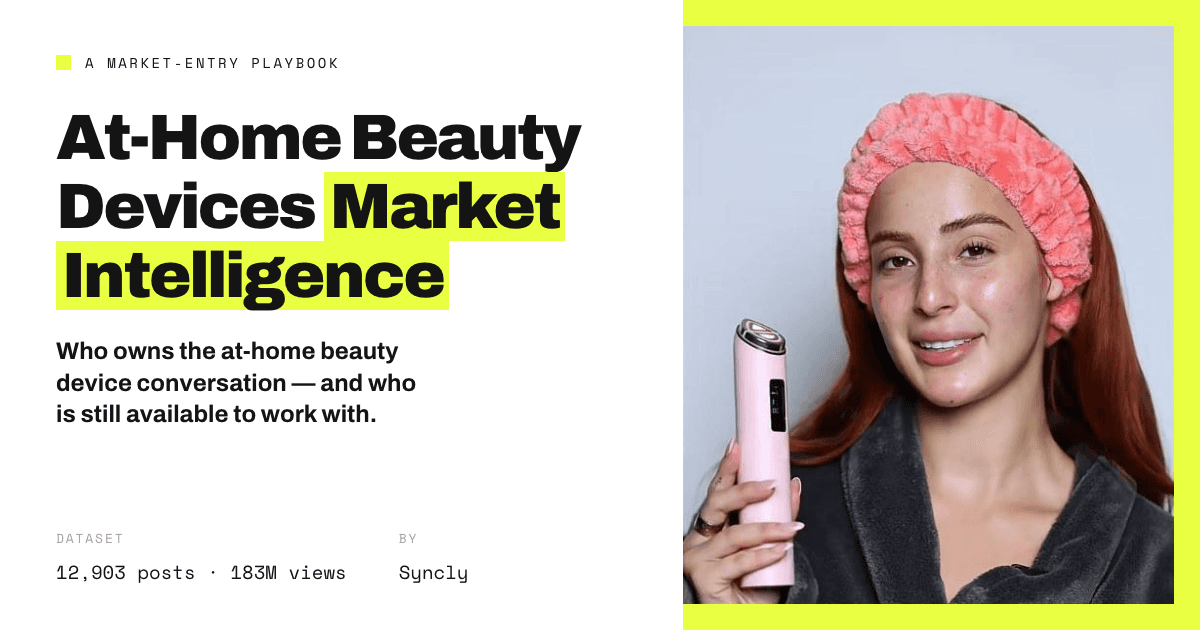


At-Home Beauty Devices: Market Intelligence Report 2026 is a market-entry map for the at-home beauty device category, built from 12,903 social posts and 183M views collected between 1 May and 5 August 2026. The headline finding: share of voice and share of attention do not line up — pick a segment on post volume alone and you walk into the crowded, quiet one.
Which at-home beauty device segment has the biggest gap between volume and attention?
Electrical current holds 24% of posts but 38% of engagement. Mechanical is the mirror image: 28% of posts and 18% of engagement. The report scores all four modalities — light & laser, electrical current, thermal & acoustic, and mechanical — on share of posts against share of engagement, so you can see which segments are loud and which are actually watched.
Which at-home beauty device segments still have no clear brand owner?
The report measures brand concentration per segment — how often the leading brand gets named per 100 posts — and flags the segments where no brand yet owns the conversation. It closes with the Modality Entry Scorecard: eight criteria scored across all four segments.
Which creators are still open for at-home beauty device partnerships?
Four creator shortlists covering 40 handles, each flagged open, already partnered, or credentialed — plus twelve worked examples, every one captured from the live post.
How was this report built?
Data source: 12,903 social posts and 183M views, collected with Syncly Social.
Period: 1 May – 5 August 2026.
Segments compared: light & laser, electrical current, thermal & acoustic, mechanical.
Measures: share of posts vs. share of engagement, brand concentration per 100 posts, creator availability.
Who is this report for?
Brand, product and marketing teams deciding where to enter at-home beauty devices, and anyone briefing creator outreach who needs to know which names are already taken. Syncly Social tracks this kind of conversation continuously, so you can follow a category, its brands and its creators without running the pull by hand.
Discover what customers truly want:
At-Home Beauty Devices: Market Intelligence Report 2026
Discover what customers truly want:
At-Home Beauty Devices: Market Intelligence Report 2026 is a market-entry map for the at-home beauty device category, built from 12,903 social posts and 183M views collected between 1 May and 5 August 2026. The headline finding: share of voice and share of attention do not line up — pick a segment on post volume alone and you walk into the crowded, quiet one.
Which at-home beauty device segment has the biggest gap between volume and attention?
Electrical current holds 24% of posts but 38% of engagement. Mechanical is the mirror image: 28% of posts and 18% of engagement. The report scores all four modalities — light & laser, electrical current, thermal & acoustic, and mechanical — on share of posts against share of engagement, so you can see which segments are loud and which are actually watched.
Which at-home beauty device segments still have no clear brand owner?
The report measures brand concentration per segment — how often the leading brand gets named per 100 posts — and flags the segments where no brand yet owns the conversation. It closes with the Modality Entry Scorecard: eight criteria scored across all four segments.
Which creators are still open for at-home beauty device partnerships?
Four creator shortlists covering 40 handles, each flagged open, already partnered, or credentialed — plus twelve worked examples, every one captured from the live post.
How was this report built?
Data source: 12,903 social posts and 183M views, collected with Syncly Social.
Period: 1 May – 5 August 2026.
Segments compared: light & laser, electrical current, thermal & acoustic, mechanical.
Measures: share of posts vs. share of engagement, brand concentration per 100 posts, creator availability.
Who is this report for?
Brand, product and marketing teams deciding where to enter at-home beauty devices, and anyone briefing creator outreach who needs to know which names are already taken. Syncly Social tracks this kind of conversation continuously, so you can follow a category, its brands and its creators without running the pull by hand.
At-Home Beauty Devices: Market Intelligence Report 2026
Discover what customers truly want:
At-Home Beauty Devices: Market Intelligence Report 2026 is a market-entry map for the at-home beauty device category, built from 12,903 social posts and 183M views collected between 1 May and 5 August 2026. The headline finding: share of voice and share of attention do not line up — pick a segment on post volume alone and you walk into the crowded, quiet one.
Which at-home beauty device segment has the biggest gap between volume and attention?
Electrical current holds 24% of posts but 38% of engagement. Mechanical is the mirror image: 28% of posts and 18% of engagement. The report scores all four modalities — light & laser, electrical current, thermal & acoustic, and mechanical — on share of posts against share of engagement, so you can see which segments are loud and which are actually watched.
Which at-home beauty device segments still have no clear brand owner?
The report measures brand concentration per segment — how often the leading brand gets named per 100 posts — and flags the segments where no brand yet owns the conversation. It closes with the Modality Entry Scorecard: eight criteria scored across all four segments.
Which creators are still open for at-home beauty device partnerships?
Four creator shortlists covering 40 handles, each flagged open, already partnered, or credentialed — plus twelve worked examples, every one captured from the live post.
How was this report built?
Data source: 12,903 social posts and 183M views, collected with Syncly Social.
Period: 1 May – 5 August 2026.
Segments compared: light & laser, electrical current, thermal & acoustic, mechanical.
Measures: share of posts vs. share of engagement, brand concentration per 100 posts, creator availability.
Who is this report for?
Brand, product and marketing teams deciding where to enter at-home beauty devices, and anyone briefing creator outreach who needs to know which names are already taken. Syncly Social tracks this kind of conversation continuously, so you can follow a category, its brands and its creators without running the pull by hand.