
Starface vs. the Dupes: Why Your Biggest Post Isn't Yours
A 12-month post-level audit of the pimple patch conversation. Why category reach is not brand reach, and how to win attribution among dupes.
Syncly Team
TL;DR: In a dupe-flooded market, most brands report the whole category conversation as if it were their own reach. A 12-month, post-level social listening audit of the "star pimple patch" conversation (3,276 posts, 7 platforms, ~24.1M views) found the single most-viewed post of the year was a $1.25 dupe that never names Starface. You don't win a dupe market by owning the category keyword. You win by knowing exactly which reach is yours, and compounding it.
The single most-viewed "star pimple patch" post of the last twelve months is one Starface never made.
It's a $1.25 Dollar Tree dupe with roughly 3 million views, and it never names the brand. That one post sits at #1 in the entire conversation. If you are a brand in a category crowded with look-alikes, this is your reality too: a large share of the reach you would proudly report belongs to somebody else.
Here is why that matters now. When a $1.25 dupe can shoot the identical viral clip, category reach and brand reach are two completely different numbers. Confuse them, and you end up funding the category while a dupe collects the checkout. This post breaks down what a full post-level audit of the Starface conversation revealed, and the playbook it points to.
The Biggest Post in Your Category Probably Isn't Yours
Raw conversation volume is not brand reach, and treating it that way inflates every report you send upstairs.
Take the seven biggest "star patch" posts of the year, per Syncly's post-level audit of the conversation. Together they pulled roughly 11.2 million views. Without an attribution layer, you would bank all seven as brand reach. Open each post, though, and only four actually name Starface. The real, brand-attributable slice is about 6.7 million views. The other three, worth around 4.5 million views, are a competitor dupe, a soccer clip, and a K-pop fancam.
Creator / Post | Views | ER | Names brand? |
|---|---|---|---|
jazzmienn × Revolve (#starfacepimplepatches) | 2.6M | 3.92% | Yes |
Starface World (official gift-set drop) | 2.3M | 1.91% | Yes |
regis (Dollar Tree dupe, #dollartree) | 2.3M | 3.83% | No |
Erika "aunty" ("STARFACE PIMPLE PATCHES") | 1.2M | 24.5% | Yes |
Lamine Yamal ("star-shaped stickers", soccer) | 1.2M | 0.56% | No |
mikha / BINI ("star pimple patch", #bini) | 1.0M | 5.92% | No |
lewischia GRWM (@STARFACE, 1 of ~35 tags) | 563.8K | 7.23% | Partial |
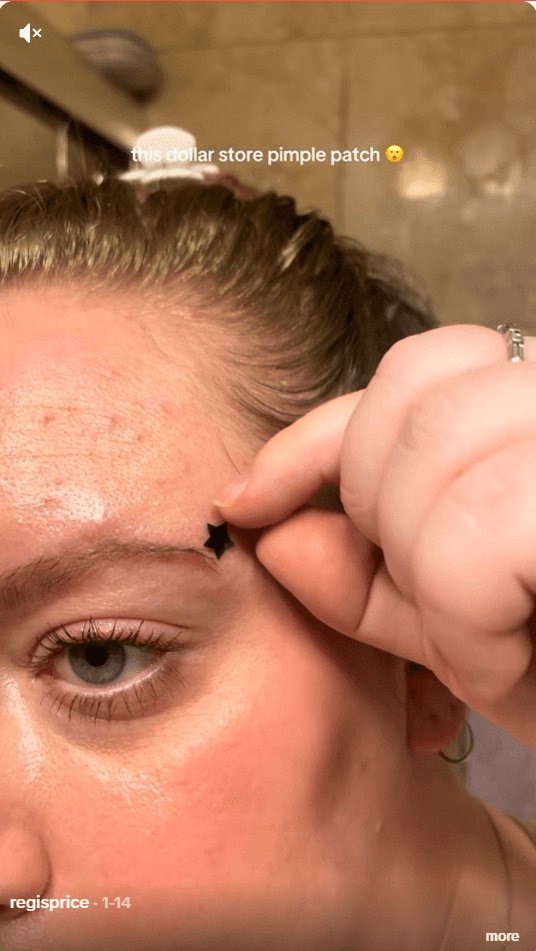
regis (Dollar Tree dupe) — 2.3M views, no Starface mention
The industry knows this gap exists and still can't close it. Across a survey of 250+ marketing leaders, 66% use creators today, but 42% name measurement as their single biggest barrier, ahead of both cost and low engagement. The trust gap shows up in what creators are used for: 82% for awareness, only 29% for direct sales (Source: Make Creator Marketing Count, 2025, Tracksuit × Morning Brew × Ekimetrics). Everyone leans on creators. Almost no one can prove what the reach is worth.
The reframe: you are not fighting for share of wallet. You are fighting for share of thumb, and the only way to claim your share is to attribute first, then measure.
Post-level attribution: scoring every post using conversation insights — is the brand named, paid or organic, which platform, what is in the content — so brand-attributable reach separates cleanly from dupes and generics.
Where You Post Is Not Where You Land
The platform that holds the volume is almost never the platform that holds the attention — which is exactly the gap cross-platform video analysis is built to catch.
In the Starface conversation, Facebook produced 58% of all posts but drove just 6% of engagement. TikTok flipped it: 6% of posts, 59% of engagement. Roughly ten times fewer posts, ten times the impact. Chase post counts and you will optimize the wrong channel.
Platform | Share of posts | Share of engagement |
|---|---|---|
58% | 6% | |
Twitter / X | 21% | 18% |
IG posts | 10% | 7% |
TikTok | 6% | 59% |
IG Reels | 3% | 11% |
Before any viral moment reaches a stakeholder, grade it on three questions — the kind an AI query layer can answer in seconds instead of a manual audit. Most dashboards answer only the first.
Reach: how many people saw it? (the view count)
Attribution: does that reach accrue to your brand? (is the brand named?)
Affinity: do people actually bond with it? (the engagement rate)
In a dupe market, the entire game is questions two and three.
Not All Engagement Accrues to You
Some viral mechanics build your brand. Others build the category and route demand straight to the cheapest patch on the shelf.
Plotting the conversation's recurring motifs on reach against attribution splits them into two groups. Ownable moments carry a brand cue a dupe can't fake. Category traps deliver huge reach or affinity with no brand attached.
Motif | What it is | Verdict |
|---|---|---|
Incidental story | A relatable, organic moment where the brand is named | Ownable, the free jackpot |
Collectible IP | A licensed compact or colorway a dupe can't reproduce | Ownable, the moat |
Identity defense | Users defending the brand, which out-engages praise | Ownable |
Branded deal | High-reach promo anchored to a real brand mention | Ownable |
Satisfying pull | ASMR popping payoff on a plain patch, no brand | Trap |
Idol / vulnerability | Parasocial fan content, high affinity, no brand | Trap |
The "satisfying pull" trap is the clearest example. The top clip of that type is an unbranded Dollar Tree dupe at 2.3M views. The ASMR payoff fires for any star patch, so the video sells the category, and price decides the winner. Fund generic "satisfying pull" content on a plain patch and you grow the category, then hand off the checkout.
The idol and fancam trap is the same story with more affinity. K-pop fancams in the set hit 16%+ engagement rates, well above most branded posts, with zero brand mentions. Pay idol rates expecting brand-scale return and you are buying an affinity play that, right now, points nowhere.
The Moat: What a Dupe Can't Copy
The line between ownable and trap comes down to one test — the same test behind any solid competitor analysis: is there a brand cue in the frame that a $1.25 dupe physically cannot reproduce?
Two motifs pass that test cleanly:
Collectible IP. A Hello Kitty / Snoopy Starface compact pulled 434.9K views at a 9.6% ER under #starfacehellokitty. A dupe copies the hydrocolloid and the star shape. It cannot put the Sanrio or Peanuts license in the frame. The collectible is the attribution.
Identity defense. Posts defending the product ("let the kids have their Starface") out-engage posts praising it, up to 11.4% ER. It works precisely because users do it, not the brand. Don't punch back at critics. Let the community carry the founding acne-positivity story.
Run every planned piece of content through the in-frame test:
Is the brand cue actually in the frame?
Could a $1.25 dupe shoot the identical clip?
If yes, it isn't yours. Rebuild it around something they can't copy.
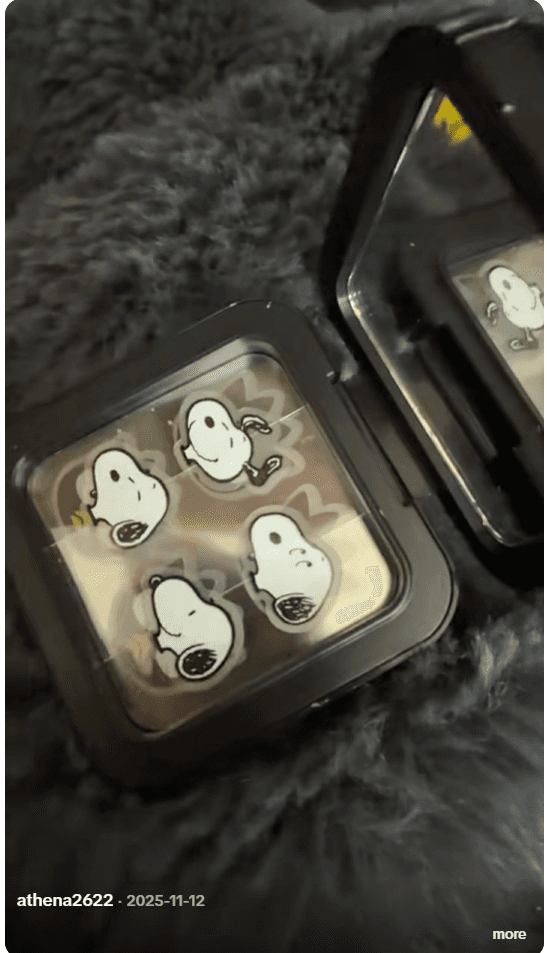
athena2622 (Collectible IP) — 434.9K views, 9.6% ER, #starfacehellokitty

cultofmegs (Identity defense) — "let the kids have their Starface," 11.4% ER
Organic Drives the Spikes. Paid Fills the Troughs.
The most valuable post of the year was free, and it got no follow-up.
Erika's "aunty" post ("WHAT AUNTY IS WEARING STARFACE PIMPLE PATCHES?????") pulled 1.2M views at a 24.5% engagement rate, the highest in the entire set, with zero CTA and fully organic reach. It isn't about the product. It's a relatable story, and the patch rides the emotional payload for free. The mistake is not the post. The mistake is having no plan to amplify it.

Erika "aunty" — 1.2M views, 24.5% ER, the top post of the year
Across twelve months of brand-attributed engagement, the giant spikes are all organic, one of them nearly 297K engagements in a single month. Paid's real job is counter-cyclical: it carries the troughs (in one December, paid beat organic 10.2K to 2.8K) and powers deliberate launches (a "2x stickier" relaunch drove paid from 26.8K to 43.5K). Concentrate paid in organic troughs and around launches — a performance monitor catches the trough before it costs you a quarter's paid spend. Don't burn it in organic-rich months when the free spikes are already doing the work.
One more edge worth naming: branded reach travels, the category keyword doesn't. A Portuguese-language post that names Starface still attributed cleanly at a 17.9% ER, higher than most English brand mentions. A named-brand mention finds you white space in markets you aren't even buying yet.
Key Takeaways
Attribute before you measure. Report the slice that names your brand, not the raw category conversation. In the Starface set, that was 6.7M of 11.2M views across the top seven posts.
Volume and attention live on different platforms. Facebook held 58% of posts and 6% of engagement; TikTok held 6% of posts and 59% of engagement.
Grade every viral moment on reach, attribution, and affinity. Most dashboards stop at reach, where the least value lives.
Build for the in-frame test. Weld the payoff to a license, packaging, or story a dupe can't reproduce, or you are subsidizing the category.
Let organic spike, let paid fill the troughs. Stand up a 24 to 48 hour amplification playbook for every organic brand mention.
Run This on Your Own Brand
If your category is full of dupes, the raw conversation number is lying to you. Some of that reach is yours, and a lot of it belongs to a $1.25 competitor you never see in a keyword report. The brands that win the dupe market are not the ones that shout the category keyword loudest. They are the ones that know precisely which reach is theirs, and compound it post by post.
Book a post-level attribution audit of your brand and see exactly which reach is yours, and which the category kept.
Data note: All figures come from a 12-month Syncly post-level audit of the "star pimple patch" conversation across 7 platforms (Jun 2025 to Jul 2026), with every headline post opened to confirm brand mention. External industry figures: Make Creator Marketing Count (2025), a survey of 250+ marketing leaders by Tracksuit × Morning Brew × Ekimetrics.


